Marks vs. Prices, Private credit and lending
Your lender's rate curve can cost 0.37x of EBITDA in debt, even with a flat spread
By Jeff Baehr, Founder & CEO, Praxis Rock Advisors
In brief
A third quarter pricing matrix left unitranche spreads flat while forward yields rose 82 bps. Under a 2.0x coverage test, sizing on the forward curve allows about 4.92x EBITDA and sizing on spot SOFR about 5.29x, a gap worth $3.7MM of debt on a $10MM EBITDA company. Ask which curve your lender sizes on before you negotiate the spread.
Your lender held its spread flat last quarter and may still have cut your debt capacity.
Valuation Research Corp.'s third-quarter matrix left unitranche spreads unchanged while forward yields rose 82 bps.
So the question isn't the spread. It's which rate curve your lender sizes coverage on. By my math, where coverage binds, that choice is worth about 0.37x of EBITDA in debt: $3.7MM on a $10MM EBITDA company, $18MM on a $50MM one. A 25 bps spread win buys about a third of that.
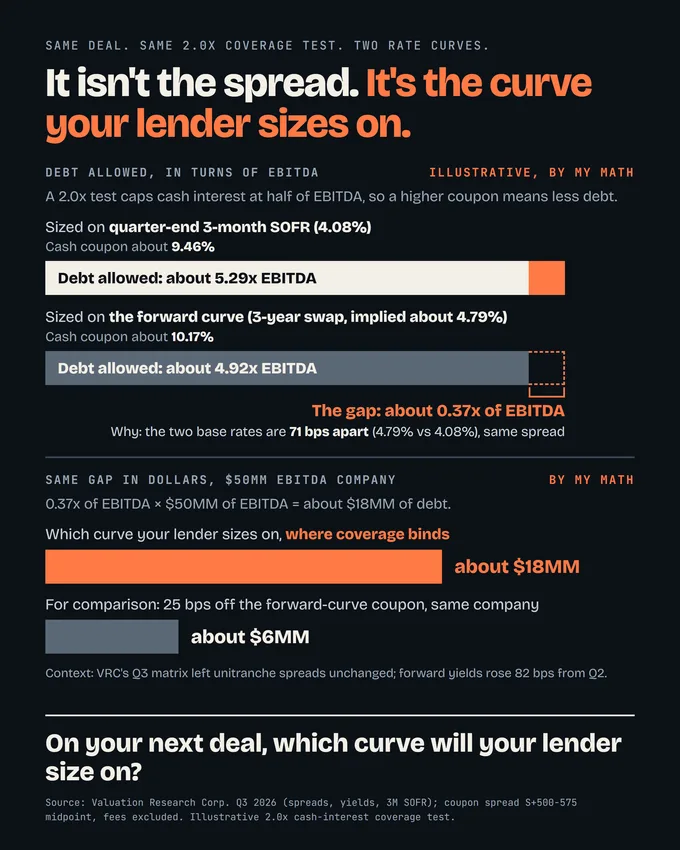
Source: see Sources below. As of October 2026.
| Figure | What it shows |
|---|---|
| 5.29x | Debt allowed, sized on quarter-end 3-month SOFR (4.08%) |
| 4.92x | Debt allowed, sized on the forward curve |
| 0.37x | The gap, in turns of EBITDA |
| $18MM | The gap in debt for a $50MM EBITDA company |
| 82 bps | Rise in forward yields while spreads held flat |
Winning spot sizing isn't what it looks like. Take the full spot amount, swap the whole loan for three years, and the coverage you sized at 2.0x runs at about 1.9x from day one, because the swap is priced off the forward curve.
VRC builds those forward yields on the three-year SOFR swap and ties the move to the Fed's mid-September hike and commentary. Spot yields rose 35 bps. In the quarter, the rate curve did all of the work.
Using VRC's coupon-spread midpoint over the swap rate implied by its forward yields, and leaving out fees, a 2.0x EBITDA-to-cash-interest test sized on the forward curve allows about 4.92x EBITDA. Sized on quarter-end three-month SOFR of 4.08%, it allows about 5.29x.
VRC's Sept. 30 matrix showed leverage and coverage ranges largely unchanged from June.
So when does it bind? At these coupons, a 2.0x test starts to bite at about five turns. GF Data's second-quarter platforms averaged total debt of 2.9x EBITDA, so the average lower-middle-market deal has room on either curve until you stretch to win it.
My view: ask which curve your lender sizes on before you negotiate the spread. If it's spot, run your own model at the swap rate you'd actually pay before you agree covenant levels, and settle the hedge in the same conversation.
If you're selling, a buyer whose lender sizes on the forward curve may need a bigger equity check to hold your price. Expect them to try to win some back in the terms.
The Fed meets Oct. 27-28, with futures pricing a real chance of another hike. On your next deal, which curve will your lender size on?
The research behind this
- Valuation Research Corp., Private credit trends, Q3 2026, October 8, 2026.
- Valuation Research Corp., Macroeconomic and interest rate trends, Q3 2026, October 2026.
- ACG, GF Data reports show steady middle-market deal flow, August 27, 2026.
- Federal Reserve, FOMC statement, September 16, 2026.